你写了一个 Agent——它调工具、搜知识库、跟用户对话。本地跑得很好。然后你要把它部署到生产环境。
这时候问题来了:Agent 跑在哪个容器里?怎么给它配工具权限?出了安全问题怎么阻断?挂了怎么知道?
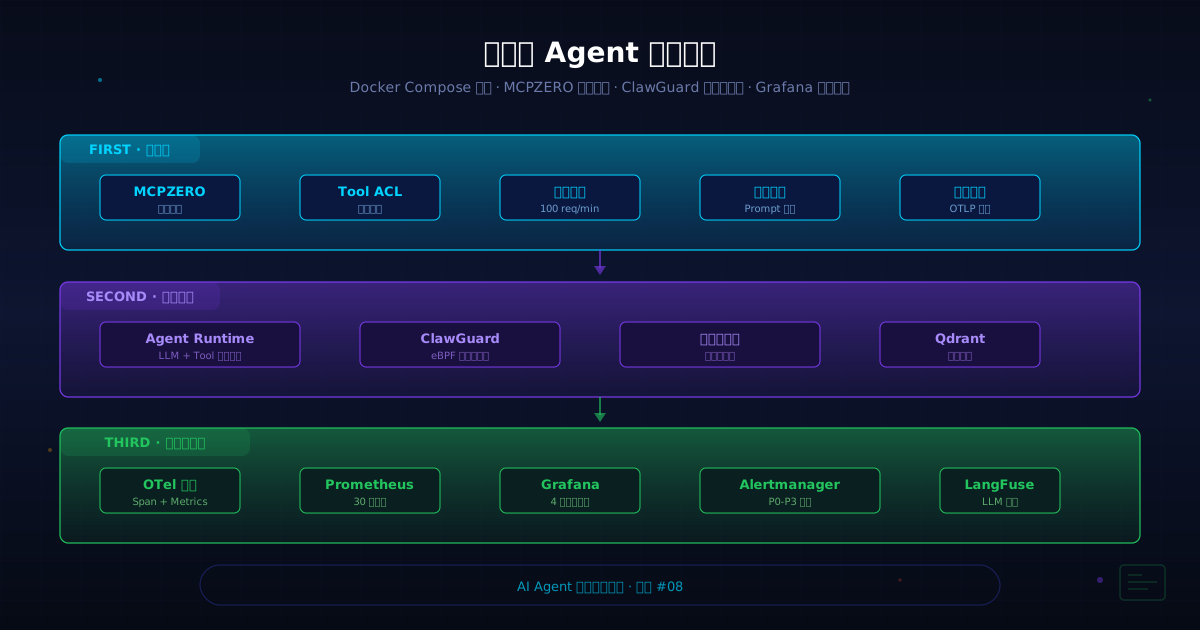
这不是把 Flask 应用扔到 Docker 里就能解决的问题。Agent 的生产部署需要一套专门的架构——网关层做访问控制、运行时层做行为监控、可观测性层做全链路追踪。这篇文章把这三层全部搭起来。
这是 AI Agent 工程实战系列的第八篇,也是收官篇。前面七篇分别讲了 RAG 检索精度、Agent 记忆系统、Tool Calling 可靠性与容错、推理延迟优化、状态管理与持久化、多 Agent 编排模式、Agent 可观测性。这一篇把所有这些组件装进同一个 Docker Compose 栈。
📌 本系列终篇:一、RAG 检索精度提升实战 → 二、Agent 记忆系统设计 → 三、Tool Calling 可靠性与容错 → 四、推理延迟优化 → 五、状态管理与持久化 → 六、多 Agent 编排模式 → 七、Agent 可观测性 → 八、生产级 Agent 部署架构(终篇)
一、三层部署架构
Agent 生产部署需要三层,缺一层都有安全或运维盲区:
┌─────────────────────────────────────────────────┐
│   用户请求(HTTP / MCP / WebSocket)              │
└─────────────────────────────────────────────────┘
                      ↓
┌─────────────────────────────────────────────────┐
│  第一层:网关层(MCPZERO / Lasso)                │
│  ─ 工具 ACL、速率限制、Prompt 注入检测、审计日志   │
└─────────────────────────────────────────────────┘
                      ↓
┌─────────────────────────────────────────────────┐
│  第二层:运行时层(Agent Runtime + ClawGuard)     │
│  ─ Agent 执行引擎、工具调用、eBPF 行为监控         │
└─────────────────────────────────────────────────┘
                      ↓
┌─────────────────────────────────────────────────┐
│  第三层:可观测性层(OpenTelemetry + Grafana)     │
│  ─ Trace 采集、指标聚合、仪表盘、告警               │
└─────────────────────────────────────────────────┘
| 层 | 职责 | 关键组件 |
|---|---|---|
| 网关层 | 所有请求的入口,做鉴权、限流、注入检测 | MCPZERO / nginx / OPA |
| 运行时层 | Agent 实际执行,工具调用管理,安全隔离 | Agent Runtime / ClawGuard / Docker |
| 可观测性层 | Trace + Metrics + Logging | OpenTelemetry Collector / Prometheus / Grafana |
这三层用 docker-compose 组织,每层独立容器、独立扩缩、独立升级。
二、Docker Compose 全栈部署
# docker-compose.yml
version: '3.8'

networks:
  agent-net:
    driver: bridge
    ipam:
      config:
        - subnet: 172.20.0.0/16

services:

  # ════════════════════════════════════════════
  # 第一层:网关层
  # ════════════════════════════════════════════

  mcp-gateway:
    image: mcpzero/gateway:latest
    ports:
      - "8080:8080"        # 对外入口
      - "9090:9090"        # 管理 API
    volumes:
      - ./gateway/policies:/policies:ro     # 策略文件
      - ./gateway/config.yaml:/config.yaml:ro
    environment:
      - GATEWAY_LOG_LEVEL=info
      - GATEWAY_RATE_LIMIT=100/min
      - GATEWAY_UPSTREAM=http://agent-runtime:8000
    networks:
      - agent-net
    healthcheck:
      test: ["CMD", "curl", "-f", "http://localhost:9090/health"]
      interval: 30s
      retries: 3
    restart: unless-stopped
    deploy:
      resources:
        limits:
          cpus: '0.5'
          memory: 512M

  # ════════════════════════════════════════════
  # 第二层:运行时层
  # ════════════════════════════════════════════

  agent-runtime:
    build: ./runtime
    ports:
      - "8000:8000"        # Agent API
    volumes:
      - ./runtime/tools:/tools:ro          # 注册的工具
      - ./runtime/config:/config:ro
      - /var/run/docker.sock:/var/run/docker.sock:ro  # ClawGuard 监控
    environment:
      - AGENT_MODEL=gpt-5.6
      - AGENT_MAX_TOKENS=8192
      - AGENT_TOOL_TIMEOUT=30s
      - OTLP_ENDPOINT=http://otel-collector:4318
    networks:
      - agent-net
    depends_on:
      - mcp-gateway
    healthcheck:
      test: ["CMD", "curl", "-f", "http://localhost:8000/health"]
      interval: 30s
      retries: 3
    restart: unless-stopped
    deploy:
      resources:
        limits:
          cpus: '2'
          memory: 4G

  clawguard:
    image: clawguard/agent:latest
    privileged: true       # 需要 eBPF 权限
    volumes:
      - /sys/kernel/debug:/sys/kernel/debug:ro
      - /sys/kernel/tracing:/sys/kernel/tracing:ro
      - /var/run/docker.sock:/var/run/docker.sock:ro
      - ./clawguard/config.yaml:/config.yaml:ro
      - clawguard_data:/data
    environment:
      - CLAWGUARD_MODE=monitor    # monitor / enforce
      - CLAWGUARD_SINK=otel
    networks:
      - agent-net
    restart: unless-stopped
    deploy:
      resources:
        limits:
          cpus: '1'
          memory: 1G

  # ════════════════════════════════════════════
  # 第三层:可观测性层
  # ════════════════════════════════════════════

  otel-collector:
    image: otel/opentelemetry-collector-contrib:0.112
    ports:
      - "4317:4317"        # gRPC
      - "4318:4318"        # HTTP
    volumes:
      - ./otel/otel-collector.yaml:/etc/otel-collector.yaml:ro
    command: ["--config=/etc/otel-collector.yaml"]
    networks:
      - agent-net
    restart: unless-stopped
    deploy:
      resources:
        limits:
          cpus: '0.5'
          memory: 512M

  prometheus:
    image: prom/prometheus:v2.53
    ports:
      - "9091:9090"
    volumes:
      - ./prometheus/prometheus.yml:/etc/prometheus/prometheus.yml:ro
      - prometheus_data:/prometheus
    command:
      - '--config.file=/etc/prometheus/prometheus.yml'
      - '--storage.tsdb.retention.time=30d'
    networks:
      - agent-net
    restart: unless-stopped
    deploy:
      resources:
        limits:
          cpus: '0.5'
          memory: 1G

  grafana:
    image: grafana/grafana:11.1
    ports:
      - "3000:3000"
    volumes:
      - ./grafana/dashboards:/etc/grafana/provisioning/dashboards:ro
      - ./grafana/datasources:/etc/grafana/provisioning/datasources:ro
      - grafana_data:/var/lib/grafana
    environment:
      - GF_SECURITY_ADMIN_PASSWORD=${GRAFANA_ADMIN_PASSWORD}
      - GF_INSTALL_PLUGINS=grafana-piechart-panel
    networks:
      - agent-net
    depends_on:
      - prometheus
    restart: unless-stopped
    deploy:
      resources:
        limits:
          cpus: '0.5'
          memory: 512M

  # ── 可选的向量存储(用于记忆 / RAG) ──
  qdrant:
    image: qdrant/qdrant:v1.12
    ports:
      - "6333:6333"
    volumes:
      - qdrant_data:/qdrant/storage
    networks:
      - agent-net
    restart: unless-stopped

volumes:
  prometheus_data:
  grafana_data:
  qdrant_data:
  clawguard_data:
零配置启动:
docker compose up -d
# 验证各组件健康状态
curl http://localhost:9090/health      # MCPZERO 网关
curl http://localhost:8000/health      # Agent Runtime
curl http://localhost:3000             # Grafana
这个栈启动后得到的是一个完整的 Agent 生产环境:网关层做安全控制,运行层做 Agent 执行和内核级监控,可观测性层让所有行为可见。
三、网关层:MCPZERO 安全网关配置
网关是 Agent 的第一道防线。所有请求先过网关,再做路由。MCPZERO 的核心配置:
# gateway/config.yaml
gateway:
  name: production-gateway
  version: "1.0"

  # ── 入站过滤 ──
  inbound:
    rate_limit: 100/min
    max_prompt_length: 32000
    blocked_keywords:
      - "ignore previous instructions"
      - "forget your rules"
      - "system prompt override"

  # ── 出站控制(Tool ACL) ──
  upstream:
    host: agent-runtime
    port: 8000
    timeout: 60s

  # ── Tool 权限控制 ──
  tools:
    allowlist:                    # 只允许这些工具
      - code_search
      - read_document
      - slack_send
      - github_pr_list
    denylist:                     # 禁止这些工具
      - execute_shell
      - delete_file
      - write_to_production_db
    per_tool_rate_limit:
      slack_send: 10/min
      code_search: 30/min

  # ── Prompt 注入检测 ──
  injection_detection:
    enabled: true
    sensitivity: medium           # low / medium / high
    custom_patterns:
      - "(?i)\\b(drop|truncate|delete)\\s+(table|database)"
      - "(?i)(sudo|chmod\\s+777|rm\\s+-rf)"

  # ── 审计日志 ──
  audit:
    enabled: true
    sink: otlp                   # 推送到 OpenTelemetry
    log_all_tool_calls: true
    log_prompt_hash: true        # 不存原始 prompt,只存 hash
关键设计原则:
- 默认拒绝:tools 必须是 allowlist 模式,不允许的工具自动拦截
- 每个工具单独限流:slack_send 和 code_search 的速率限制不同,防止一个工具被滥用拖慢其他工具
- Prompt hash 存储:审计日志不存原始 prompt 内容,只存 hash 用于查重和溯源,兼顾合规和隐私
四、运行时层:Agent Runtime + ClawGuard
4.1 Agent Runtime 架构
Agent Runtime 是个轻量的 HTTP 服务,接收网关转发过来的请求,协调 LLM + 工具调用:
# runtime/app.py — Agent Runtime 入口

from fastapi import FastAPI
from pydantic import BaseModel
from opentelemetry import trace
import httpx, json

app = FastAPI()
tracer = trace.get_tracer("agent-runtime")

class AgentRequest(BaseModel):
    session_id: str
    messages: list
    tools: list[str] = []

@app.post("/chat")
async def agent_chat(req: AgentRequest):
    with tracer.start_as_current_span("agent.run") as span:
        span.set_attribute("session.id", req.session_id)
        span.set_attribute("agent.tools.count", len(req.tools))

        # 1. LLM 判断需要调用哪些工具
        with tracer.start_as_current_span("llm.plan") as plan_span:
            plan = await llm_plan(req.messages, req.tools)
            plan_span.set_attribute("llm.plan.tools", json.dumps(plan))

        # 2. 执行工具调用
        results = []
        for tool_call in plan.tool_calls:
            with tracer.start_as_current_span(f"tool.{tool_call.name}") as tool_span:
                tool_span.set_attribute("tool.name", tool_call.name)
                tool_span.set_attribute("tool.params", json.dumps(tool_call.params))
                result = await execute_tool(tool_call)
                tool_span.set_attribute("tool.success", result.success)
                results.append(result)

        # 3. 生成最终回复
        with tracer.start_as_current_span("llm.respond") as resp_span:
            reply = await llm_generate(req.messages, results)
            resp_span.set_attribute("llm.response.tokens", reply.total_tokens)

        return {"reply": reply.text, "trace_id": span.get_span_context().trace_id}
4.2 ClawGuard 运行时监控
ClawGuard 通过 eBPF 无侵入地监控 Agent 的所有系统调用——文件读写、网络连接、进程创建。不需要改 Agent 代码:
# clawguard/config.yaml
clawguard:
  mode: monitor                 # monitor(只记录)或 enforce(拦截)

  # ── 监控范围 ──
  capture:
    - syscall: execve           # 监控进程创建
      target: agent-runtime
    - syscall: connect          # 监控网络连接
      target: agent-runtime
    - syscall: openat           # 监控文件访问
      target: agent-runtime
      path_pattern: "/etc/passwd, /data/production/*"

  # ── 异常规则 ──
  rules:
    - name: "block-unexpected-exec"
      condition: "execve.comm != 'python3' && execve.comm != 'node'"
      action: alert             # monitor 模式仅告警
    - name: "block-prod-db-access"
      condition: 'connect.dest_port == 5432 && connect.dest_ip != "172.20.0.10"'
      action: alert
    - name: "block-sensitive-files"
      condition: 'openat.path matches "/etc/shadow|/home/*/.ssh/*"'
      action: alert

  # ── 输出 ──
  sink:
    type: otlp                  # 推送到 OpenTelemetry
    endpoint: http://otel-collector:4318
ClawGuard 与网关的分工:
- 网关层管「Agent 不应该做什么」——工具级 ACL、Prompt 注入检测
- ClawGuard 管「Agent 运行时不能做什么」——系统调用级行为监控
两者互补:网关拦截了工具层面的违规,ClawGuard 捕获了绕过网关后的底层异常行为。
五、可观测性层:Trace + Metrics + Dashboard
工程实战系列的 第七篇 详细讲了 Agent 的 Span 设计、Trace 结构和行为基线建模。这里只展示如何把那些概念落地到实际配置。
5.1 OpenTelemetry Collector
# otel/otel-collector.yaml
receivers:
  otlp:
    protocols:
      grpc:
        endpoint: 0.0.0.0:4317
      http:
        endpoint: 0.0.0.0:4318

processors:
  batch:
    timeout: 3s
    send_batch_size: 512
  # 采样:全量保留 metrics 和错误 trace,
  # 正常 trace 按 10% 采样
  probabilistic_sampler:
    hash_seed: 42
    sampling_percentage: 10

exporters:
  prometheus:
    endpoint: 0.0.0.0:8889
    namespace: agent
    resource_to_telemetry_conversion:
      enabled: true
  debug:
    verbosity: normal

service:
  pipelines:
    traces:
      receivers: [otlp]
      processors: [probabilistic_sampler, batch]
      exporters: [debug]
    metrics:
      receivers: [otlp]
      processors: [batch]
      exporters: [prometheus, debug]
5.2 Prometheus 指标
Agent Runtime 暴露的关键指标:
# Agent 请求总数
agent_requests_total{agent="assistant-v3", version="1.2.0"}
# 工具调用延迟
agent_tool_latency_seconds{tool="code_search"}
# LLM token 消耗
agent_llm_tokens_total{model="gpt-5.6", type="output", unit="tokens"}
# 工具调用成功率
agent_tool_success_ratio{tool="slack_send"}
# 网关拦截次数
gateway_blocked_requests_total{reason="injection_detected"}
# ClawGuard 告警数
clawguard_alerts_total{rule="block-unexpected-exec"}
5.3 Grafana 仪表盘
预配置的 Agent 监控仪表盘包含四个面板:
面板 1:Agent 健康状态(左上)
├── QPS(最近 5 分钟折线图)
├── P50 / P95 / P99 延迟(柱状图)
├── 错误率(百分比仪表盘)
└── 工具调用成功率(按工具分组的柱状图)
面板 2:网关安全(右上)
├── 拦截请求数(按原因聚合的饼图)
├── 速率限制命中数(时间序列)
├── Prompt 注入检测(最近 10 条审计记录)
└── 活跃连接数(折线图)
面板 3:Runtime 状态(左下)
├── 活跃 Session 数(折线图)
├── 工具调用分布(按工具 + 按时段的热力图)
├── LLM token 消耗速率(按模型分组的面积图)
└── Agent 决策路径(Tool call 链深度分布直方图)
面板 4:ClawGuard eBPF 监控(右下)
├── 系统调用事件率(按类型分组的折线图)
├── 异常规则命中数(柱状图)
├── 敏感文件访问记录(最近 20 条日志)
└── 容器进程白名单偏离报警(表格)
数据源配置和 dashboard JSON 文件直接挂载到 Grafana 容器:
# grafana/datasources/datasource.yaml
apiVersion: 1
datasources:
  - name: Prometheus
    type: prometheus
    access: proxy
    url: http://prometheus:9090
    isDefault: true
六、横向扩缩与生产硬化
6.1 多 Agent 水平扩展
当单个 Agent Runtime 不够用(QPS > 100 或内存 > 4GB),用 docker-compose scale 扩展:
# 扩展到 3 个 Agent Runtime 实例
docker compose up -d --scale agent-runtime=3

# 反向代理做负载均衡
# 修改 gateway 配置,upstream 指向多个 agent-runtime
# gateway/config.yaml — 多实例上游
upstream:
  hosts:
    - agent-runtime:8000
    - agent-runtime-2:8000
    - agent-runtime-3:8000
  strategy: least_connections  # 最小连接优先
6.2 K8s 部署(可选)
对于需要自动扩缩容、滚动更新的团队,K8s 部署模式:
# k8s/agent-runtime-deployment.yaml
apiVersion: apps/v1
kind: Deployment
metadata:
  name: agent-runtime
spec:
  replicas: 3
  selector:
    matchLabels:
      app: agent-runtime
  template:
    spec:
      containers:
        - name: runtime
          image: agent-runtime:latest
          resources:
            requests:
              memory: "2Gi"
              cpu: "1"
            limits:
              memory: "4Gi"
              cpu: "2"
          livenessProbe:
            httpGet:
              path: /health
              port: 8000
---
# HPA:CPU > 70% 或 QPS > 100 时自动扩容
apiVersion: autoscaling/v2
kind: HorizontalPodAutoscaler
metadata:
  name: agent-runtime-hpa
spec:
  scaleTargetRef:
    apiVersion: apps/v1
    kind: Deployment
    name: agent-runtime
  minReplicas: 2
  maxReplicas: 10
  metrics:
    - type: Resource
      resource:
        name: cpu
        target:
          type: Utilization
          averageUtilization: 70
6.3 生产硬化清单
| 项目 | 配置 | 优先级 |
|---|---|---|
| 容器非 root 运行 | user: nobody 或 runAsNonRoot: true |
P0 |
| 网络隔离 | API 只监听 agent-net,不暴露到 host |
P0 |
| 密钥管理 | .env 文件不 commit,使用 secrets manager |
P0 |
| 资源限制 | 每个容器设 CPU/memory limits | P1 |
| 日志轮转 | docker-compose 配置 logging: max-size: "10m" max-file: "3" |
P1 |
| 健康检查 | 每个关键服务配置 healthcheck |
P1 |
| 安全更新 | 每周自动拉取基础镜像安全更新 | P2 |
七、与安全系列架构的衔接
本系列第七篇讲的是 Agent 可观测性的「数据面」——Trace 怎么设计、Span 怎么打。这一篇是「控制面」——这些 Trace 数据怎么收、存在哪、仪表盘怎么配置。
同时,这篇的 MCPZERO 网关配置和之前安全系列的 从零搭建企业级 MCP 安全架构 是同一个 Gateway 的不同视角——那篇侧重安全策略的声明式配置(OPA/Rego),这篇侧重把 Gateway 放进部署栈(Docker Compose + 可观测性集成)。
三者形成完整体系:
安全系列 2.4: MCPZERO + OPA 策略引擎 → 网关层的安全策略定义
工程系列 07:   OpenTelemetry + LangFuse → 可观测性的数据标准
工程系列 08:   Docker Compose + Grafana → 全栈的落地部署
写在最后
这一篇把工程实战系列的最后一环补上了。回头看整个系列,从 RAG 检索精度开始,经过记忆系统、Tool Calling 可靠性、推理延迟、状态管理、多 Agent 编排、可观测性,到今天这篇部署架构——刚好形成了一个完整的工程闭环。
这个系列停在这里很合适。它不是「写完了所有关于 Agent 工程的东西」,而是「建立了一套覆盖开发到生产的思维框架」。以后碰到任何 Agent 工程问题,都能在这个框架里找到自己的位置:是 RAG 检索的问题?看第一篇。是推理太慢?看第四篇。是不知道出了什么问题?看第七篇和第八篇。
后续重心会转回 AI Agent 安全系列。工程系列的八个主题中已经埋了不少安全伏笔——Tool Calling 容错里的供应链风险,状态管理里的记忆泄露,部署架构里的网关防御——这些会在安全系列里一一展开。
本系列第八篇,全系列终篇。全系列目录:一、RAG 检索精度 → 二、Agent 记忆系统 → 三、Tool Calling 可靠性 → 四、推理延迟优化 → 五、状态管理 → 六、多 Agent 编排 → 七、Agent 可观测性 → 八、生产级 Agent 部署架构。